Gráficos de Composição de Índices da B3

Com o pacote {rb3} é possível obter a composição dos índices da B3, como o IBOVESPA, por exemplo. Vamos construir alguns gráficos donuts para avaliarmos a distribuição da composição dos índices.

R
rb3
opendata
Author

Wilson Freitas

Published

June 1, 2022

Recentemente, eu implementei no pacote {rb3} um conjunto de funções que baixam dados de índices do site da B3.

Vou mostrar aqui como utilizar a função rb3::index_weights_get, que retorna um data.frame com todas as ações que compõem um determinado índice, juntamente com os seus respectivos pesos no índice.

Vamos começar carregando os pacotes {rb3} e {tidyverse} que utilizo.

library(rb3)
library(tidyverse)
── Attaching packages ─────────────────────────────────────── tidyverse 1.3.2 ──
✔ ggplot2 3.4.1     ✔ purrr   1.0.1
✔ tibble  3.1.8     ✔ dplyr   1.1.0
✔ tidyr   1.3.0     ✔ stringr 1.5.0
✔ readr   2.1.4     ✔ forcats 1.0.0
── Conflicts ────────────────────────────────────────── tidyverse_conflicts() ──
✖ dplyr::filter() masks stats::filter()
✖ dplyr::lag()    masks stats::lag()
height <- 7.5
width <- 7.5

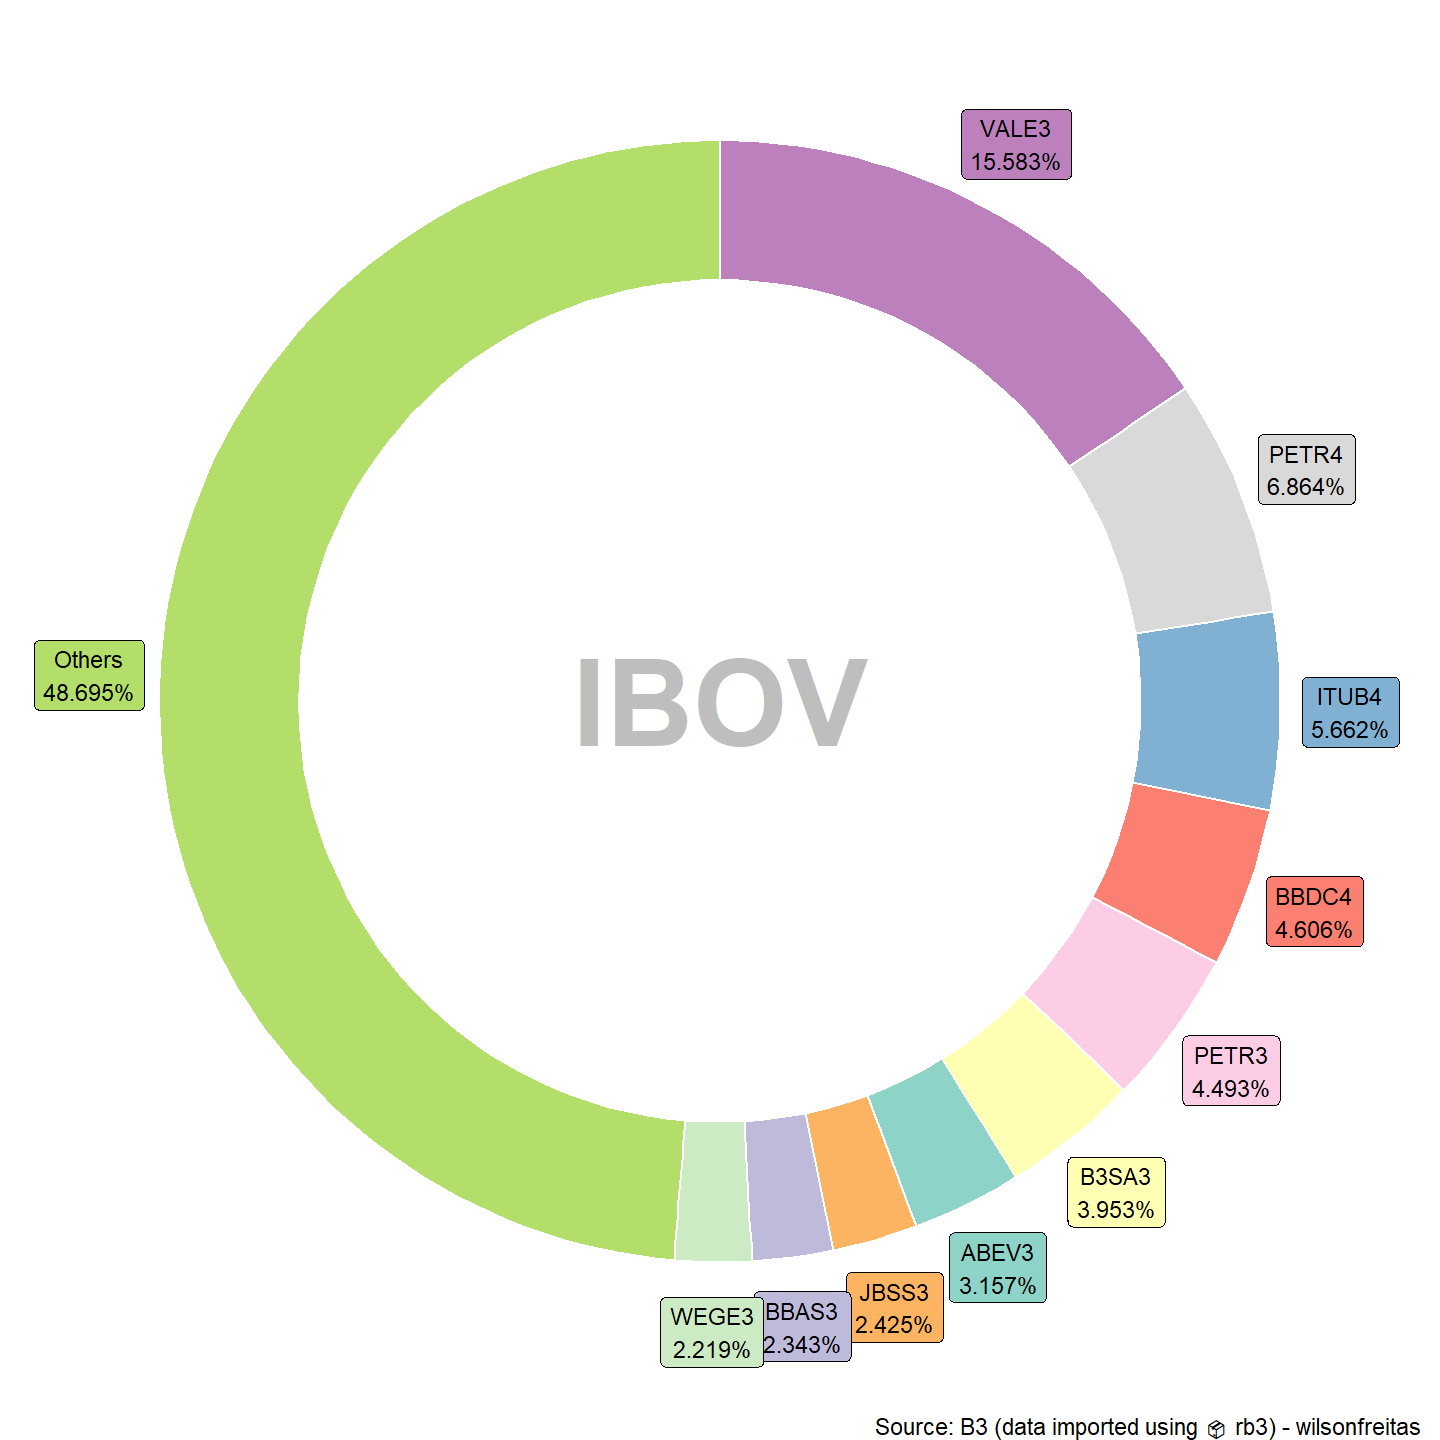
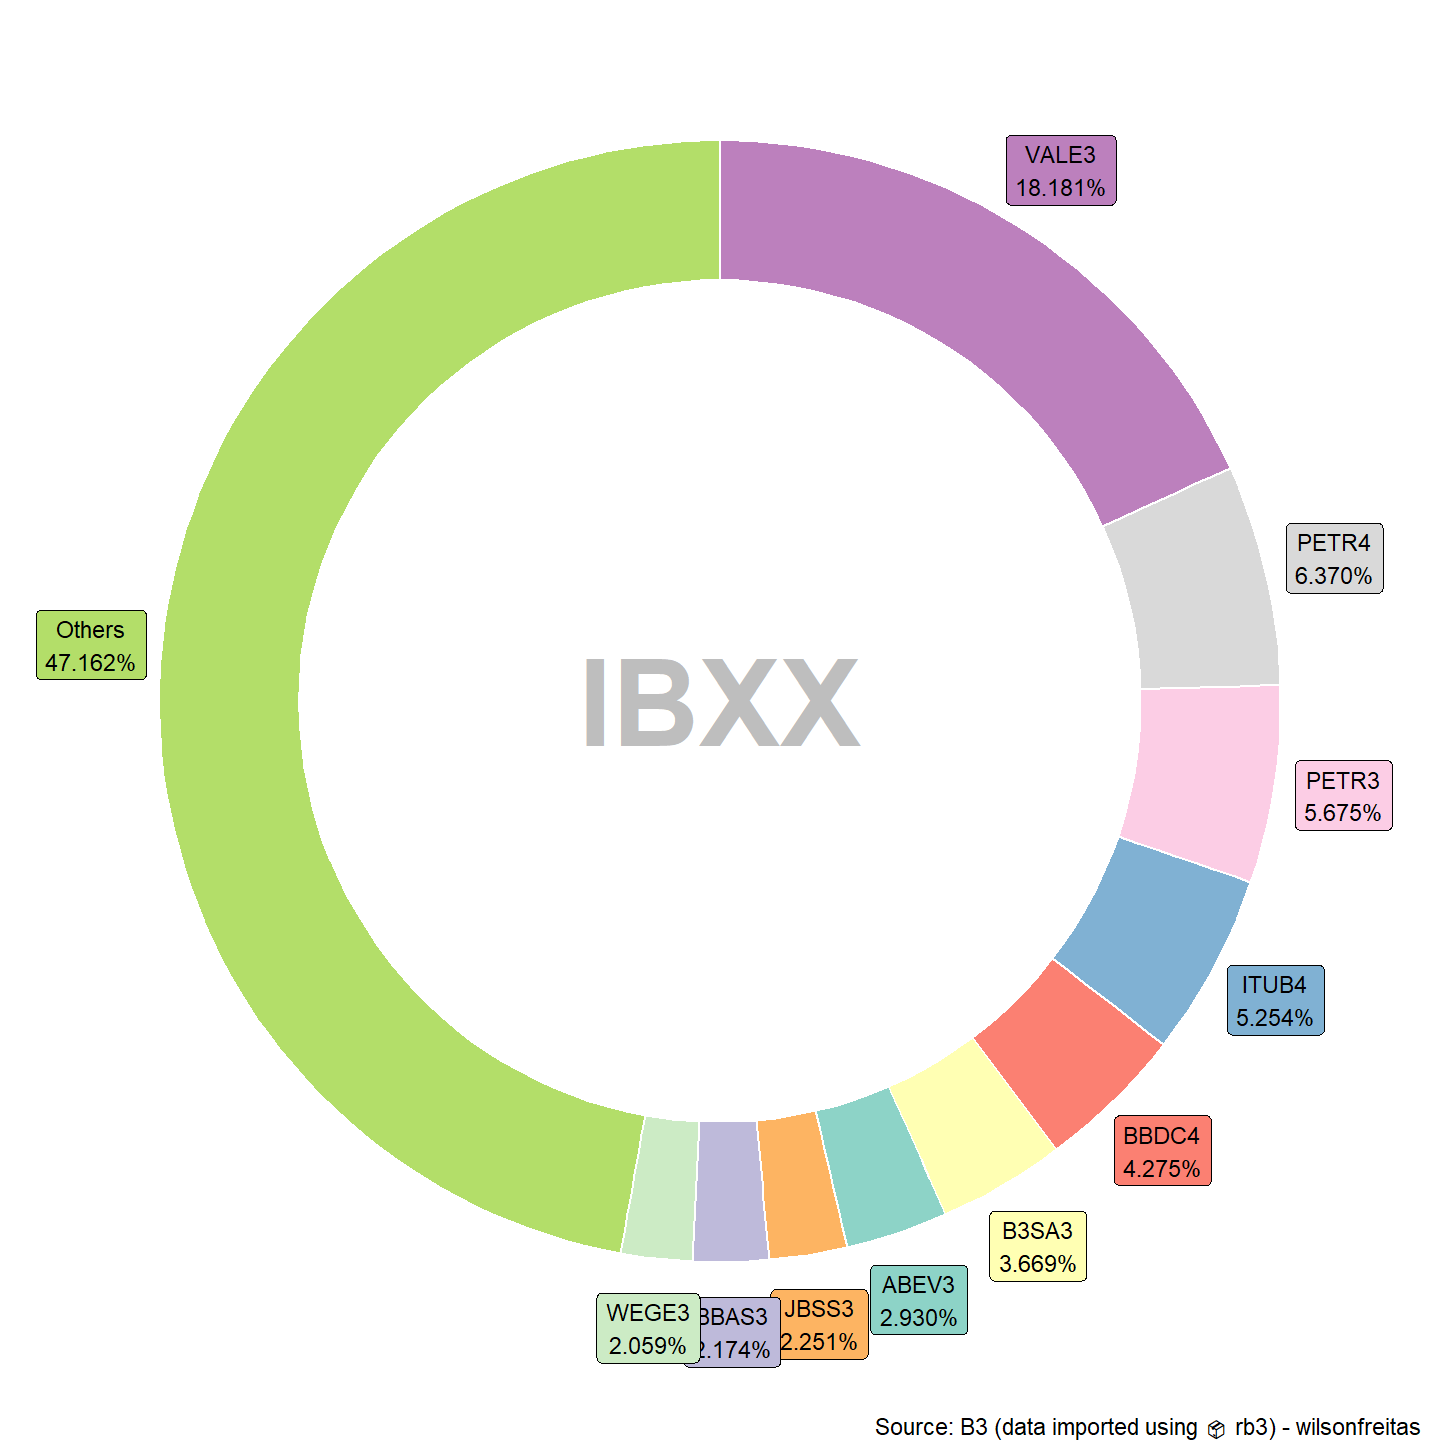
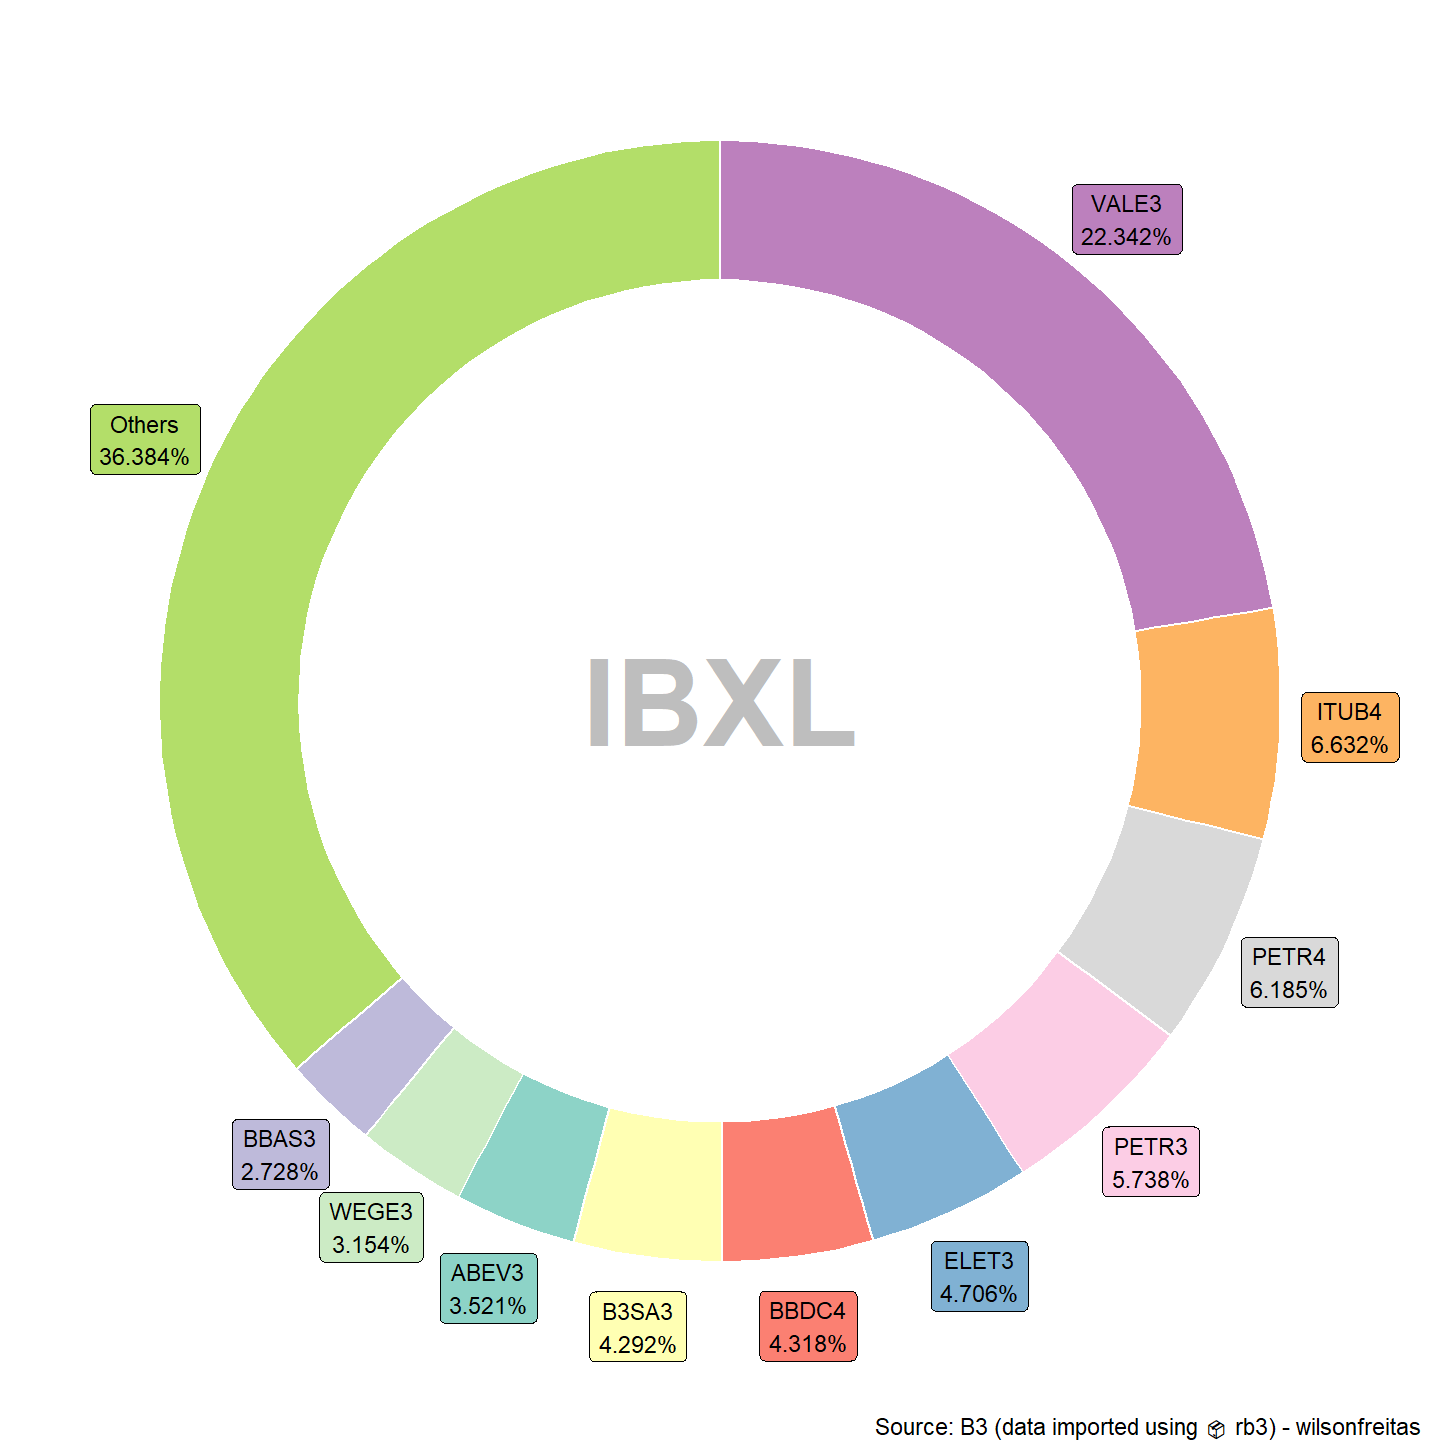
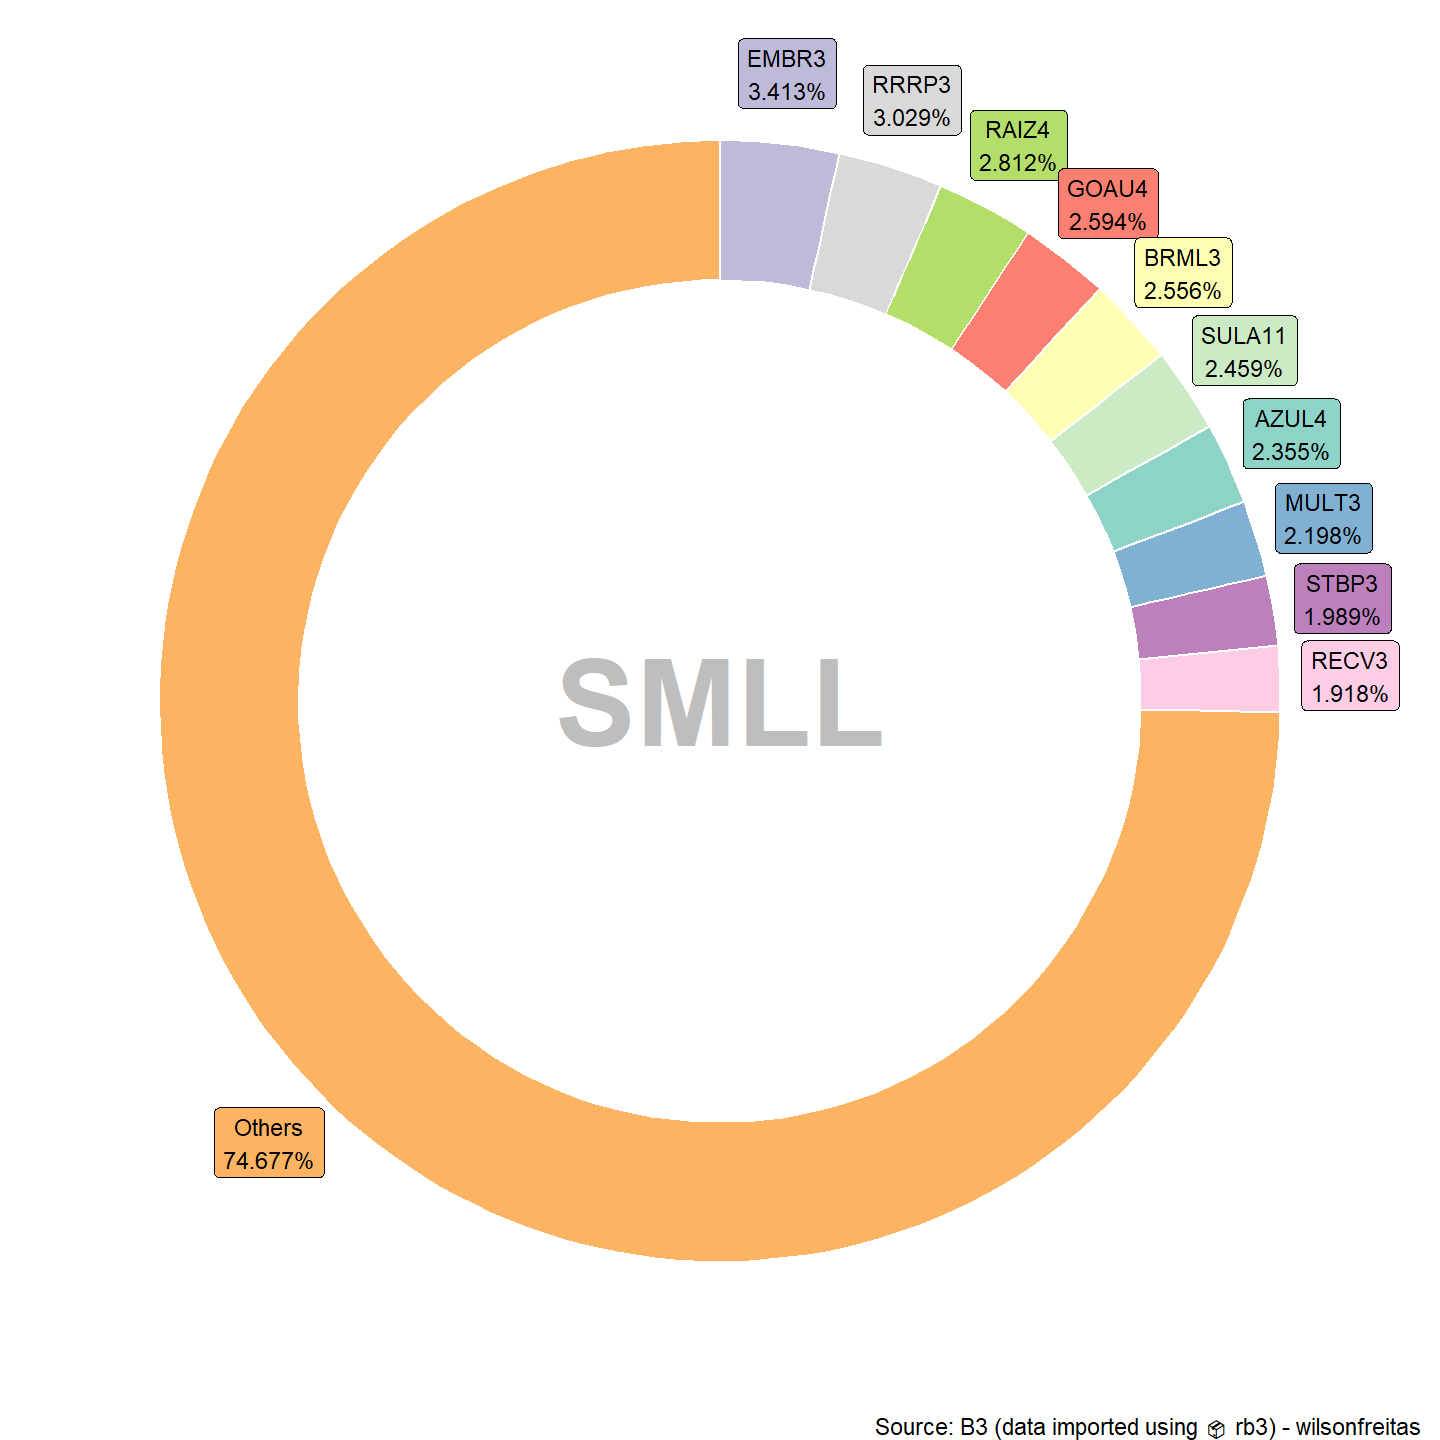
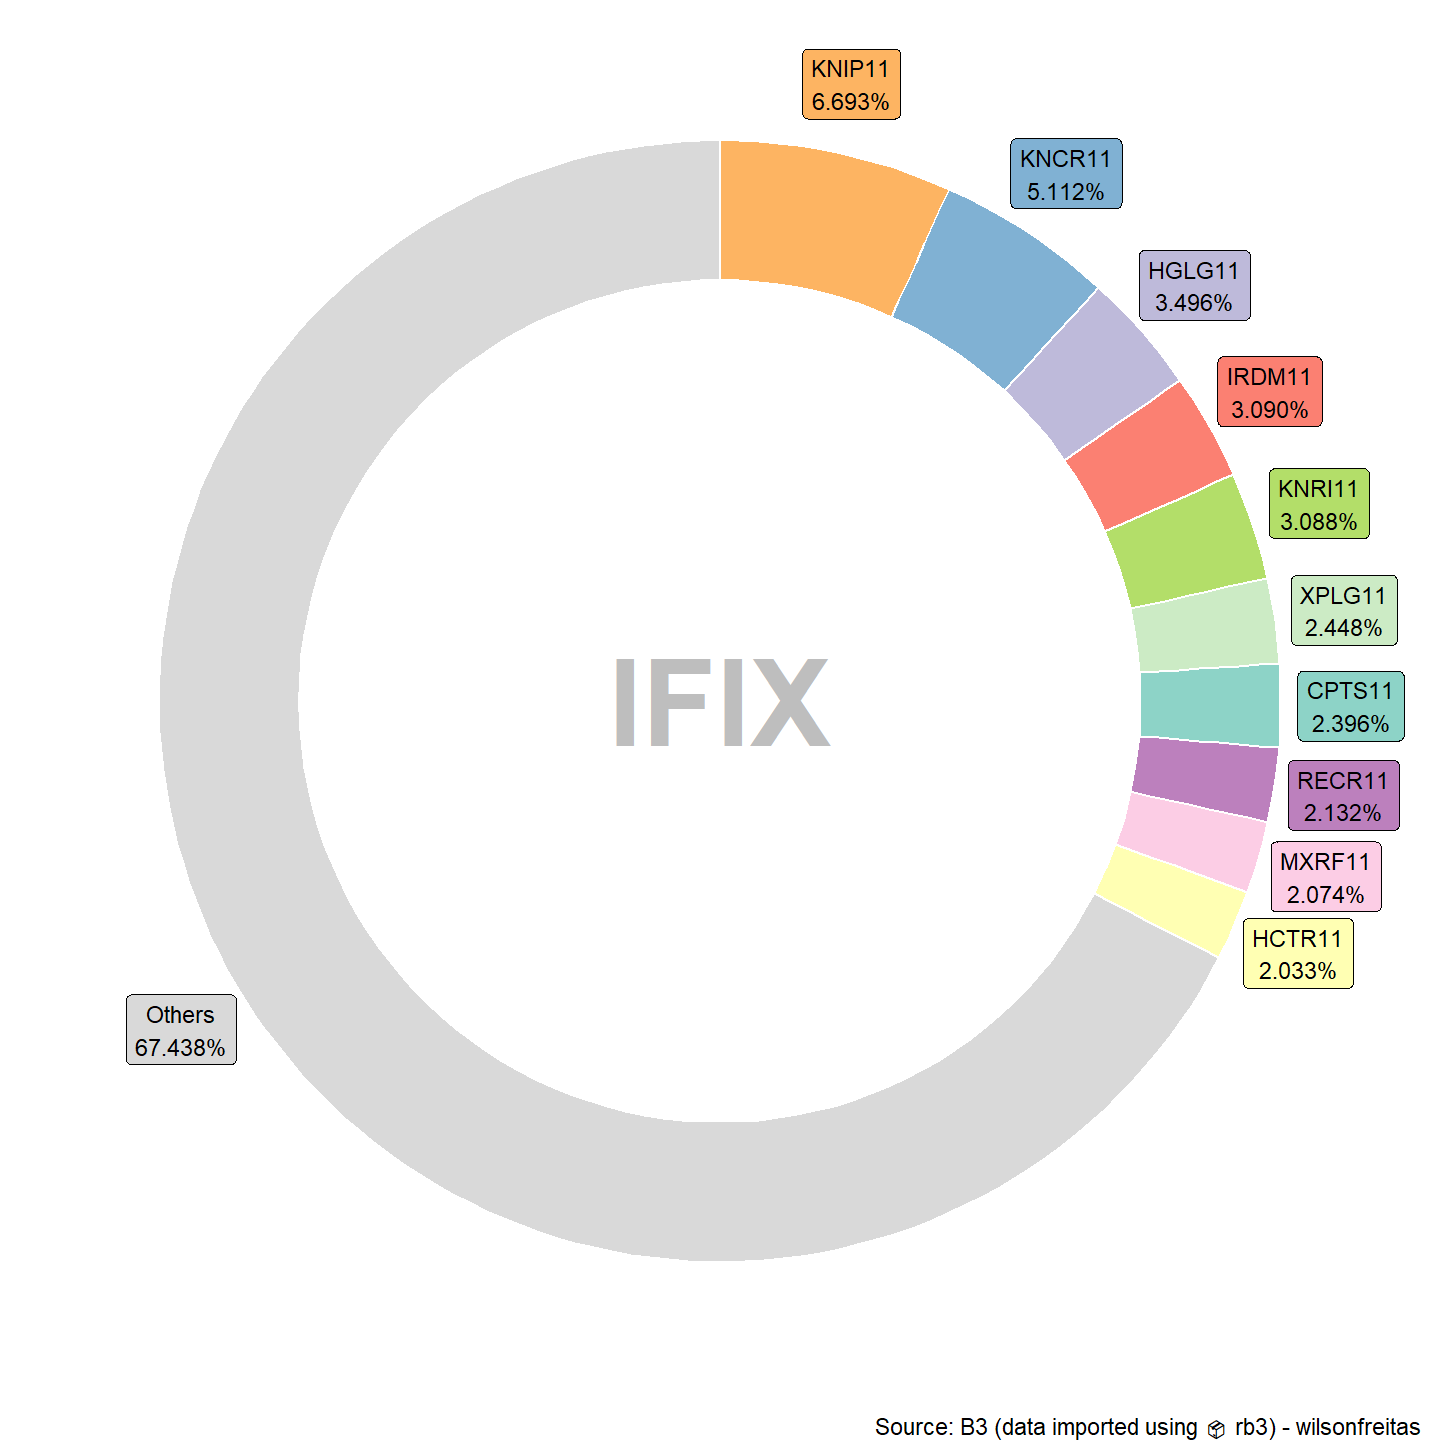
A ideia aqui é avaliar a distribuição de ativos em alguns índices, a saber: IBOV, IBXX, IBXL, SMLL e IFIX. Contudo, essa avaliação será realizada da seguinte forma: os 10 ativos com a maior participação nos índices serão selecionados e os demais ativos serão colocado em um grupo definido como Others. Assim vou fazer um gráfico de donut (uma pizza com furo no meio) apresentando a participação de cada ativo no índice. Dessa maneira será possível avaliar a concentração dos índices.

Para fazer essa seleção dos ativos e o agrupemento dos demais eu criei a função top_weight. Esta função já prepara o data.frame para a função ggdonut que constroi o gráfico de donut.

top_weight <- function(.data, n = 10) {
    top_10 <- .data |>
        arrange(desc(weight)) |>
        slice_head(n = n) |>
        select(symbol, weight)
    total_weight <- sum(top_10$weight)
    others <- tibble(
        symbol = "Others",
        weight = 1 - total_weight
    )

    bind_rows(top_10, others) |>
        mutate(cum_weight = cumsum(weight)) |>
        mutate(
            ymax = cum_weight,
            ymin = c(0, head(cum_weight, n = -1)),
            label_pos = (ymax + ymin) / 2,
            label = paste0(symbol, "\n", scales::percent(weight)),
            symbol = factor(symbol, ordered = TRUE)
        )
}

ggdonut <- function(.data, index_name) {
    ggplot(.data, aes(
        ymax = ymax, ymin = ymin,
        xmax = 4, xmin = 3,
        fill = symbol
    )) +
        geom_rect(colour = "white") +
        geom_label(
            x = 4.5, aes(y = label_pos, label = label), size = 3
        ) +
        annotate(
            "text",
            x = 0, y = 0, label = index_name, size = 16, colour = "grey",
            fontface = 2
        ) +
        coord_polar(theta = "y") +
        scale_fill_brewer(palette = "Set3") +
        scale_color_brewer(palette = "Set3") +
        xlim(c(0, 4)) +
        theme_void() +
        theme(legend.position = "none") +
        labs(
            caption = "Source: B3 (data imported using \U1F4E6 rb3) - wilsonfreitas"
        )
}

IBOVESPA

index_name <- "IBOV"
index_weights_get(index_name) |>
    top_weight() |>
    ggdonut(index_name)

IBX 100

index_name <- "IBXX"
index_weights_get(index_name) |>
    top_weight() |>
    ggdonut(index_name)

IBX 50

index_name <- "IBXL"
index_weights_get(index_name) |>
    top_weight() |>
    ggdonut(index_name)
Warning: Automatic coercion from double to character was deprecated in purrr 1.0.0.
ℹ Please use an explicit call to `as.character()` within `map_chr()` instead.
ℹ The deprecated feature was likely used in the rb3 package.
  Please report the issue at <https://github.com/wilsonfreitas/rb3/issues>.

SMALL

index_name <- "SMLL"
index_weights_get(index_name) |>
    top_weight() |>
    ggdonut(index_name)

IFIX

index_name <- "IFIX"
index_weights_get(index_name) |>
    top_weight() |>
    ggdonut(index_name)